

Trusted by best logistics teams







When systems don’t connect, teams fill the gap


Before Firefighting loop
Plan

Execute
Gaps show up
Firefighting
Repeat


Plans miss real-world constraints
Issues get fixed in the moment
Fixes stay local
The next plan starts from scratch
Nothing actually improves
After Learning loop
Plan
Execute
Learn
Improve
Issues are caught early
What happens on-ground feeds into planning
Each run starts better than the last
Each run starts better than the last
A system that improves with every run
How Mojro works
data ingestion
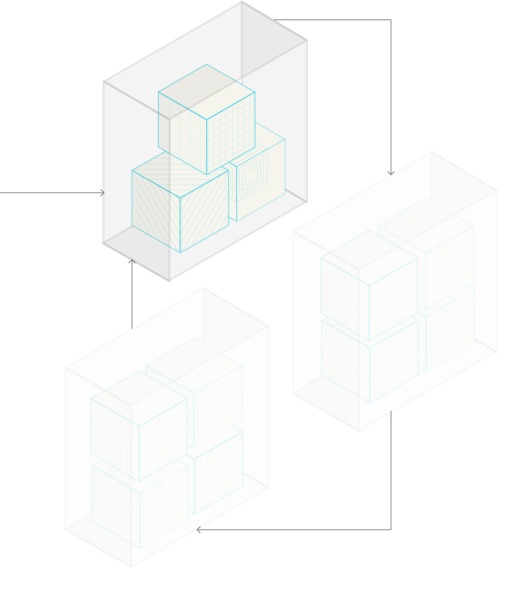
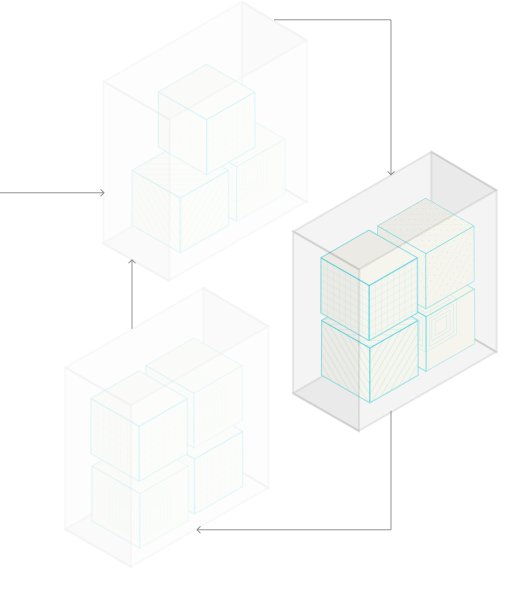
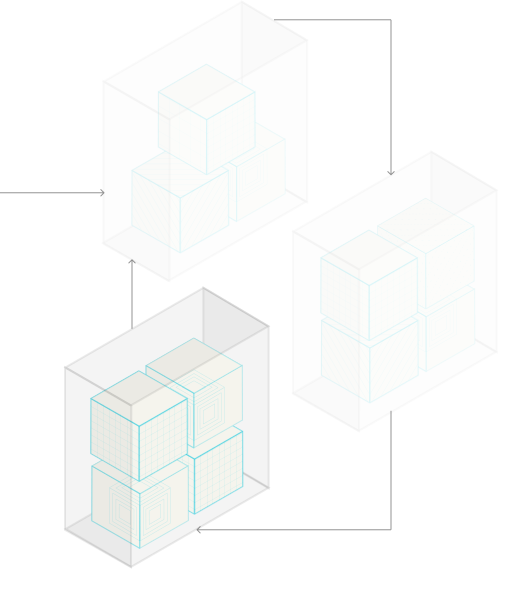
Execution data feeds back to Planning so next plan cycle become more accurate
What gets better with every delivery cycle
Less firefighting. More predictable operations. Lower costs.

Time windows get more accurate
Actual service times and stop durations refine schedules.
Routes reflect real conditions
Plans account for real traffic on routes, not map assumptions.
Better driver and carrier assignment
Assign based on delivery success rates, on-time performance, and exception frequencies.
Retail Procurement
Plans stock movement to your DC — multi-modal, multi-day, multi-leg. Factors in DC receiving capacity so goods arrive when the dock can handle them.

Customer availability becomes predictable
Delivery patterns show when customers are actually available.
Retail Procurement
Plans stock movement to your DC — multi-modal, multi-day, multi-leg. Factors in DC receiving capacity so goods arrive when the dock can handle them.

Constraints reflect how operations actually run
Dock delays, loading times, etc shape future plans.
Retail Procurement
Plans stock movement to your DC — multi-modal, multi-day, multi-leg. Factors in DC receiving capacity so goods arrive when the dock can handle them.

Issues don't recur
Frequent exceptions turn into planning rules.
What improves each run doesn’t reset. It compounds.


These improvements don’t stay isolated.

They build on everything that’s already happened across your routes, your customers, and your operations.
Over time, your system doesn’t just get better. It becomes specific to how you run.
Proven in real operations
15%
reduction in logistics costs
20%
improvement in vehicle utilization
95%+
Delivery SLA Adherance

Operators speak

Mojro is playing a crucial role in HUL's vision of supply chain transformation. Their state-of-the-art logistics optimization technology has helped us realize improvement in time to market, reduce the inventory holdings and save significant logistics costs.

Alok Joshi
Vice President Supply Chain, Customer Service, Logistics & Transformation

In the course of the 3-year journey, the Mojro team has worked with us at every step to understand and solve problems, innovate and scale our business. We are now embarking on a journey of digitizing and optimizing our entire supply chain with Mojro.

Shashi Kumar
Co-Founder & Chief Executive Officer

"Mojro has brought in the much-needed visibility into our delivery operations. We have been able to push our teams to achieve beyond 90% on-time deliveries in our distribution with help from Mojro. Process Automation of the Cash and Crate collection process on the Mojro App is resulting in improved efficiency on the ground. Periodic optimization with Mojro has also pushed up our capacity utilization and brought in cost savings."

Pramod Prasad
Chief Operating Officer
See what optimized logistics looks like