
Multi-Depot Orchestration
Run your depot network at full potential - not partial capacity.
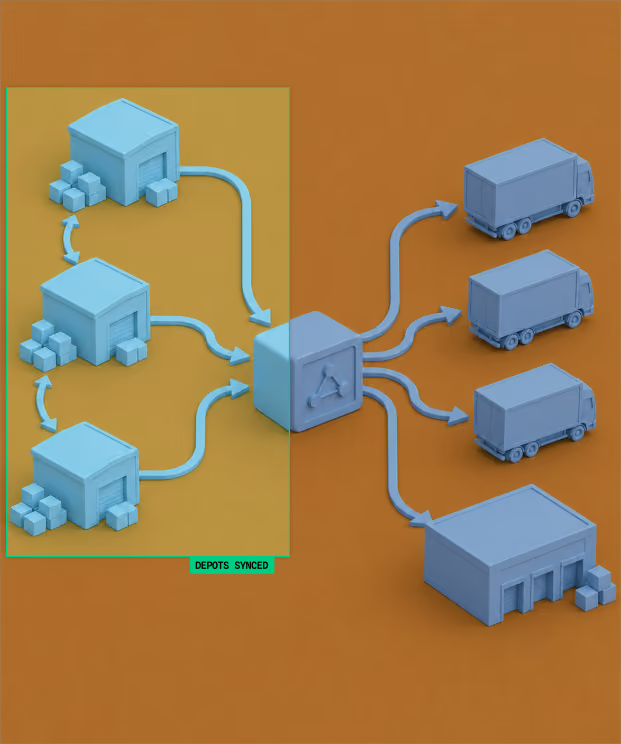
Mojro coordinates flows across all your depots simultaneously. Cross-depot transfers, vehicle pooling, and demand rebalancing are all solved in one single run, so your network performs at its potential, not just each depot in isolation.
The problem
Depots planned in isolation
don't add up to an
optimized network.
Each depot optimizes its own vehicles and drivers, with no visibility into what the neighboring depot can absorb.
Cross-depot transfers get negotiated manually between depot managers.
Demand imbalances get handled with emergency bookings and not network re-balancing.
Network-level cost only becomes visible in the monthly P&L. By then, the inefficiency has already repeated itself 30 times.

Capabilities
Every depot. Every transfer. Every pooling opportunity. Solved as one.
01 Network-level optimization
Stop optimizing depots. Start optimizing the network.
All depots, hubs, and cross-dock points are modeled as nodes in a single network graph. Mojro optimizes flows across the full network in one run, not depot by depot.

02 Cross-depot transfer planning
When one depot is full and another has room, Mojro finds it.
When demand at depot A exceeds capacity and depot B has surplus, Mojro identifies the transfer opportunity, optimal quantity and timing to schedule the movement.
03 Last-mile delivery
Build Last-mile routes with complete visibility
Fleet capacity is shared across depot locations only when pooling benefits exceeds repositioning cost.
04 Demand rebalancing
Match demand to capacity across the entire network.
Order volumes are shifted between depots before dispatch. Demand is matched to available capacity across the full network.
05 Cross-leg exception handling
Disruption on one leg triggers re-optimisation across the network
Intermediate cross-dock timing, vehicle arrival coordination, and transfer manifests are generated automatically for every multi-leg movement.

06 Network cost visibility
See your total network cost in every planning cycle
Transport, transfer, and cross-dock handling costs are computed and reported for every planning cycle. The data your team needs for depot and network-level decisions is there when needed.


What actually changes when Mojro plans your full network?
100%
adherence to SLA
6 - 7%
cumulative depot cost savings because of better consolidation
10 -15%
better fleet utilization
One network. One plan. Every depot finally working together.