
Transportation planning and optimization, built for enterprise scale.
Mojro gives enterprise shipper teams the algorithmic intelligence native to every workflow, operational visibility with complete execution data, pre-built connectors to integrate with your existing stack, and the production reliability to trust - all in one single platform.
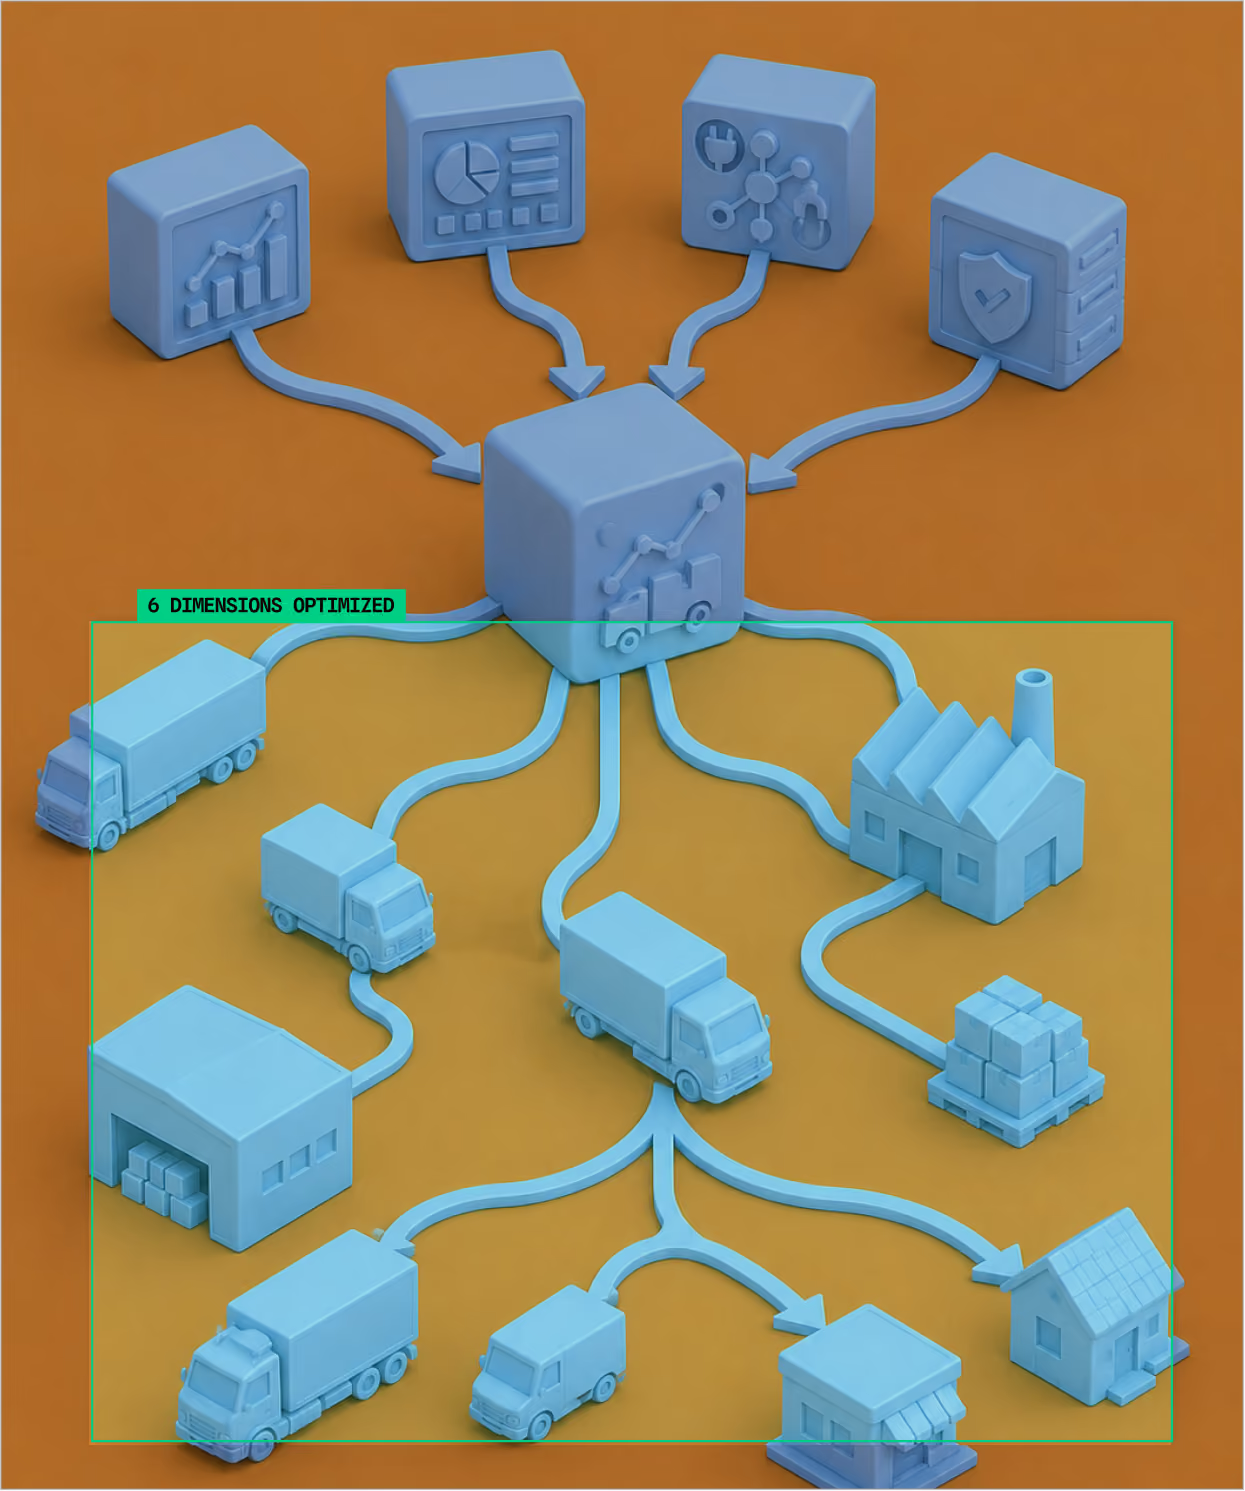
The platform, in four parts
Built to plan, run, integrate, and scale.
Algorithmic Intelligence
Operations research and machine learning solve all 6 dimensions simultaneously - not sequentially. Every optimization decision has a human-readable explanation though AI, and address intelligence is trained to deliver accurate geocoding across geographies.
Operational Visibility
Plan vs. actual, cost per delivery, vehicle utilization, on-time performance, and carrier scorecards - all generated automatically after every planning cycle. Operations teams gets live fleet status, SLA status. Finance gets reports on trip reduction, cost improvement.
Enterprise Integration
Pre-built connectors for SAP, Oracle, and every major TMS, WMS, and OMS - augmenting your existing infrastructure. Most integrations go live within the first two weeks, supported by a dedicated implementation engineer from Mojro's team.
Production-Grade Trust
100,000+ orders processed daily. 15,000 orders optimized in under 5 minutes. 99.9% uptime SLA across every enterprise deployment. Enterprise-grade encryption, role-based access, SOC 2 Type II, ISO 27001 certified, and data residency in US.

Artificial Intelligence
AI that is embedded in every workflow, not a dashboard add-on.
Artificial intelligence in Mojro is embedded in every planning and execution workflow. It explains every decision, recommends in context, and learns from real-world execution data with below three production-hardened capabilities.

Optimization Engine
Operations research plus machine learning meta-modeling solve all six transportation dimensions simultaneously and not sequentially. Millions of computations per run, on every customer deployment.

Explainable AI
Most optimization platforms fail because planners override what they can't explain. Every Mojro assignment comes with a plain-language rationale. Why this vehicle, which constraints were binding, why the alternative was rejected.

Address Intelligence
A custom small language model parses enterprise address data into structured components and resolves to rooftop-level coordinates, trained on regional address patterns across India, US, and Southeast Asia.



Operational Visibility
The data your leadership asks for, generated automatically.
Every optimization run and every delivery produces data. Mojro turns that data into the reports VP Logistics, Chief Supply Chain Officers, and finance teams ask for. No manual assembly, no spreadsheet exports.
Six reports, generated after every planning cycle.
Plan vs. actual report
Compared automatically by route, driver, carrier, region, and day.
Cost per delivery trending
Tracked against the optimization baseline rolling 7, 30 & 90-day windows.
Vehicle utilization report
Space and weight utilization per vehicle, route, and fleet segment.
On-time delivery performance report
On-time rate by route, carrier, time window, and customer
Exception analytics reportFrequency, type, and resolution time by route, driver, carrier, and region.
Carrier performance report
Per-carrier on-time rate, actual vs. committed capacity, exception frequency, and cost-per-delivery.

Operations sees today, finance sees the trend.
For VP Logistics & Operations
Live fleet status, today's plan vs. actual, exception queue with SLA status, and cost-per-delivery vs. target - on a single screen, updated as deliveries complete.
For Finance & Leadership
Monthly and quarterly reports on trip count reduction, utilization gain, and cost per delivery vs. the pre-Mojro baseline - the data that justifies the investment.

Enterprise integration
Built to work with everything you already run.
Mojro augments your existing infrastructure and doesn't replace it. It has pre-built connectors for SAP, Oracle, and every major TMS, WMS, and OMS. Most integrations go live in days with a dedicated Mojro implementation engineer by your side.
What it connects to
Every system in your logistics stack is connected.
ERP
SAP, Oracle, Microsoft Dynamics

IoT & Telematics
GPS, sensors, fuel, driver behaviour

OMS
D2C and omnichannel order fulfillment

TMS
Receives order data and returns optimized plans





Procurement & Inbound
Purchase orders, supplier consolidation
wms
Order release, dock scheduling, fulfillment
Customer Notifications
SMS, email, customer portal webhooks
Traffic/External Data
Live traffic feed, weather, carrier APIs, port/rail

Production-Grade Trust
Production at scale. Security at depth. Compliance in motion.
Mojro is a production system. The numbers below come from live enterprise deployments, not benchmarks, not lab conditions.
Scale in production
Numbers from live enterprise deployments.
100K+
Peak daily orders

15K
Orders optimized in 5 minutes
<5 min
Re-optimize a 200-vehicle fleet
99.9%
Platform uptime SLA
Enterprise-grade security
Every data flow is encrypted. Every access is authenticated. Every event is audited.
SOC 2
Type II certified
Report available under NDA.
ISO 27001
Compliant
Information security management
Data Residency
Production environments in US
See the platform that plans, runs, integrates, and scales.